I help organisations use data to make good decisions. I have worked in the public healthcare system for several years and I'm passionate about this space.
My analysis tool of choice is R and I am experienced with a range of tools including Tableau, PowerBI, and Python as well as database tools like MySQL, Oracle Database, and Snowflake .
I specialise in structuring data, building user-friendly dashboards, and providing tailored education to help you and your team realise your data's potential.
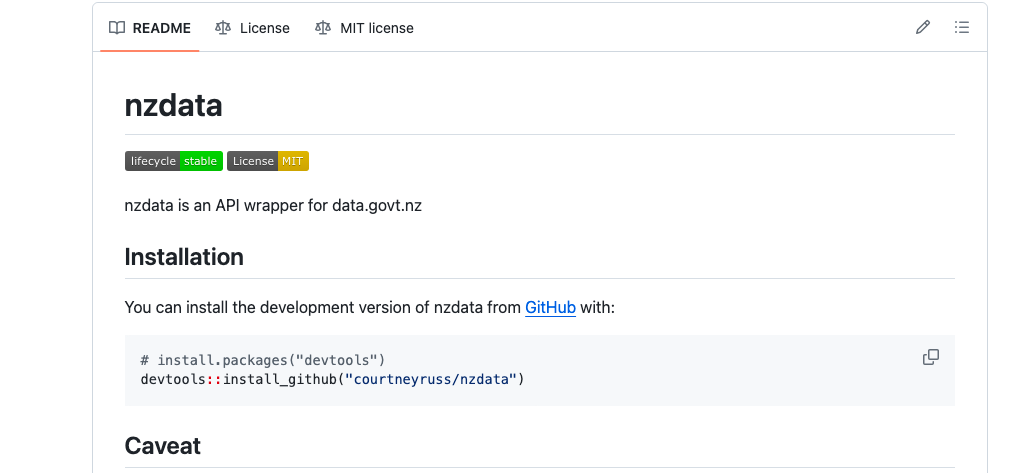
nzdata is an open source API wrapper for data.govt.nz to improve ease of use for non-developers.
License: MIT
This application allows users to find EV charging stations across New Zealand. Results can be filtered by time limit and cost.
Created in R using Shiny and Leaflet.
This dashboard uses TradeMe Property data to find the expected price of a property based on its features including city, number of bedrooms, and number of bathrooms.
This dashboard was created in Tableau with data scraped using webscraper.io and processed in Tableau Prep. This was part of a group assignment for BUSAN300 at The University of Waikato.
See full report here
This is an analysis of my entire Spotify streaming history. It uses the Spotify Web API to extract track details and demonstrates a range of exploratory data analysis techniques.
Created in R.
This analysis uses multiple regression to model the volume of breast milk produced by an exclusively-pumping mother.
Go to document